Signal Engine
An options day-trading bot that spends most of its time deciding not to trade, and a control plane that shows you every one of those decisions.
- Trades
- Short-dated SPY options
- Status
- In progress
- Runs on
- Self-hosted, against Tradier
- Built with
- Python, FastAPI, SQLite
Most trading bots are black boxes.
Signal Engine is an options day-trading platform I built end to end. A Python engine trades short-dated SPY options on a trend-following signal, and a FastAPI control plane shows every decision it made. Plus every decision it refused to make.
That second half is the part I actually care about.
An opaque bot either trades or it doesn't, and a flat day looks exactly like a broken one. You end up staring at a log file trying to work out whether nothing happened because the market was quiet, or because your code stopped running three hours ago.
So this one writes down everything. Not just the trades, the whole decision: what the price was, what the trend said, which rule objected, and what the objection cost. That's how the dashboard can tell you why any given second did or didn't produce a trade, and it's why a flat day reads as the system working instead of the system down.
Every five seconds
The engine runs the same loop every five seconds, in the same order, every time. Nothing gets skipped and nothing happens silently.
First it checks whether it's even allowed to be awake: the kill switches and the trading schedule. Then it grabs the price and the quote, reads the tape for trend and volatility, and pulls the account's current state so any sizing works on real numbers.
Then it runs the guardrails. All seventeen of them, in order. If a single one objects, that's the end of the loop.
Only if everything passes does it go shopping. It picks the nearest at-the-money contract that clears a screen on spread, size, open interest and volume, sizes the trade off a risk budget and the stop distance, puts in a limit order, and watches the position on its own five-second clock until something says get out. Then it writes the trade down, pings Slack, and cools off before it's allowed to go in again.
That guardrail step is where almost everything ends.
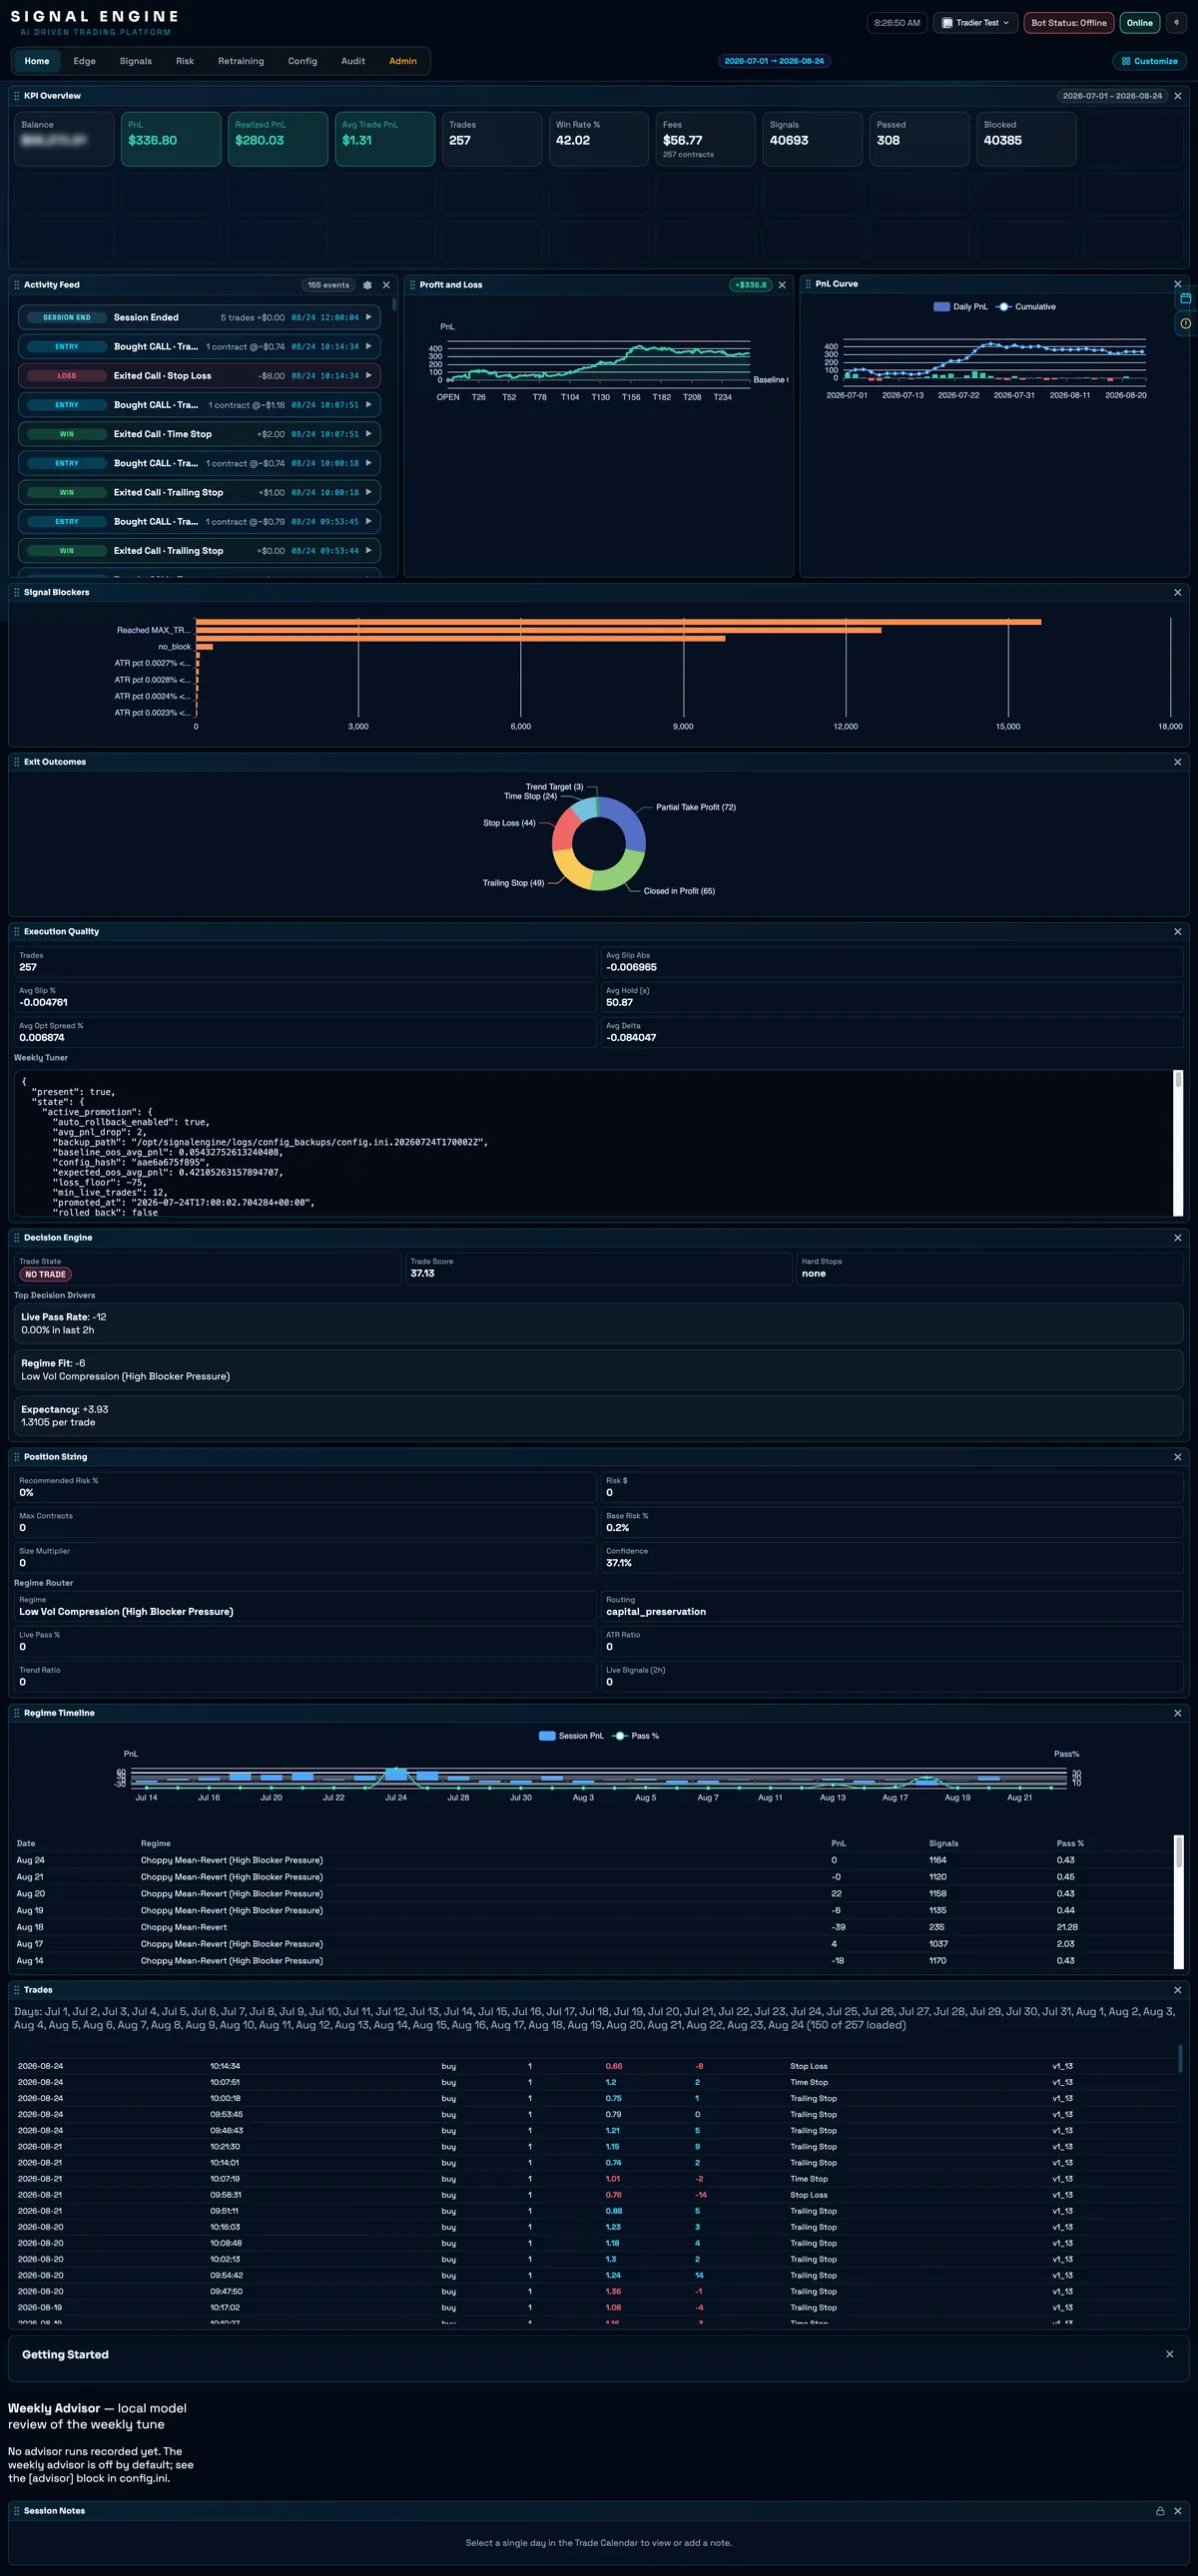
40,385 of 40,693 signals stopped right there. The rest of the loop ran for the other 0.8%.
I know that looks like a failure rate. It isn't one. The strategy is a filter, and a filter that lets everything through is just a market order on a timer. What matters is that every one of those 40,385 rejections is on the record with a reason attached, so "why didn't it trade today?" gets an answer instead of a shrug.
The biggest hammer
Most of the guardrails just say no. Spread too wide, volatility too low, too many trades today, too many stop-losses in a row. The entry doesn't happen and the loop moves on.
Four of them do a lot more than that. The kill switch, the daily loss limit, a mismatch between my books and the broker's, and too many errors in a row will all flatten every open position and halt the engine outright.
And here's the funny part. Those four are the ones I trust least to be right on their own. That's exactly why they get the biggest hammer.
I would rather be stopped out by a false alarm at noon than find out at four o'clock that the account and the broker disagreed all afternoon.
Getting out works the same way in reverse. There are nine ways out of a position, checked in strict priority order every poll, so the most protective one always wins. A hard dollar stop sits at the top of the ladder. A plain "you've held this long enough" ceiling sits at the bottom, no exceptions.
Why didn't it trade?
The control plane has seven views, and each one answers a different question. Every panel is a widget you can drag around, hide, or scope to a date range, and the live numbers arrive over a WebSocket, so the page never has to keep asking.
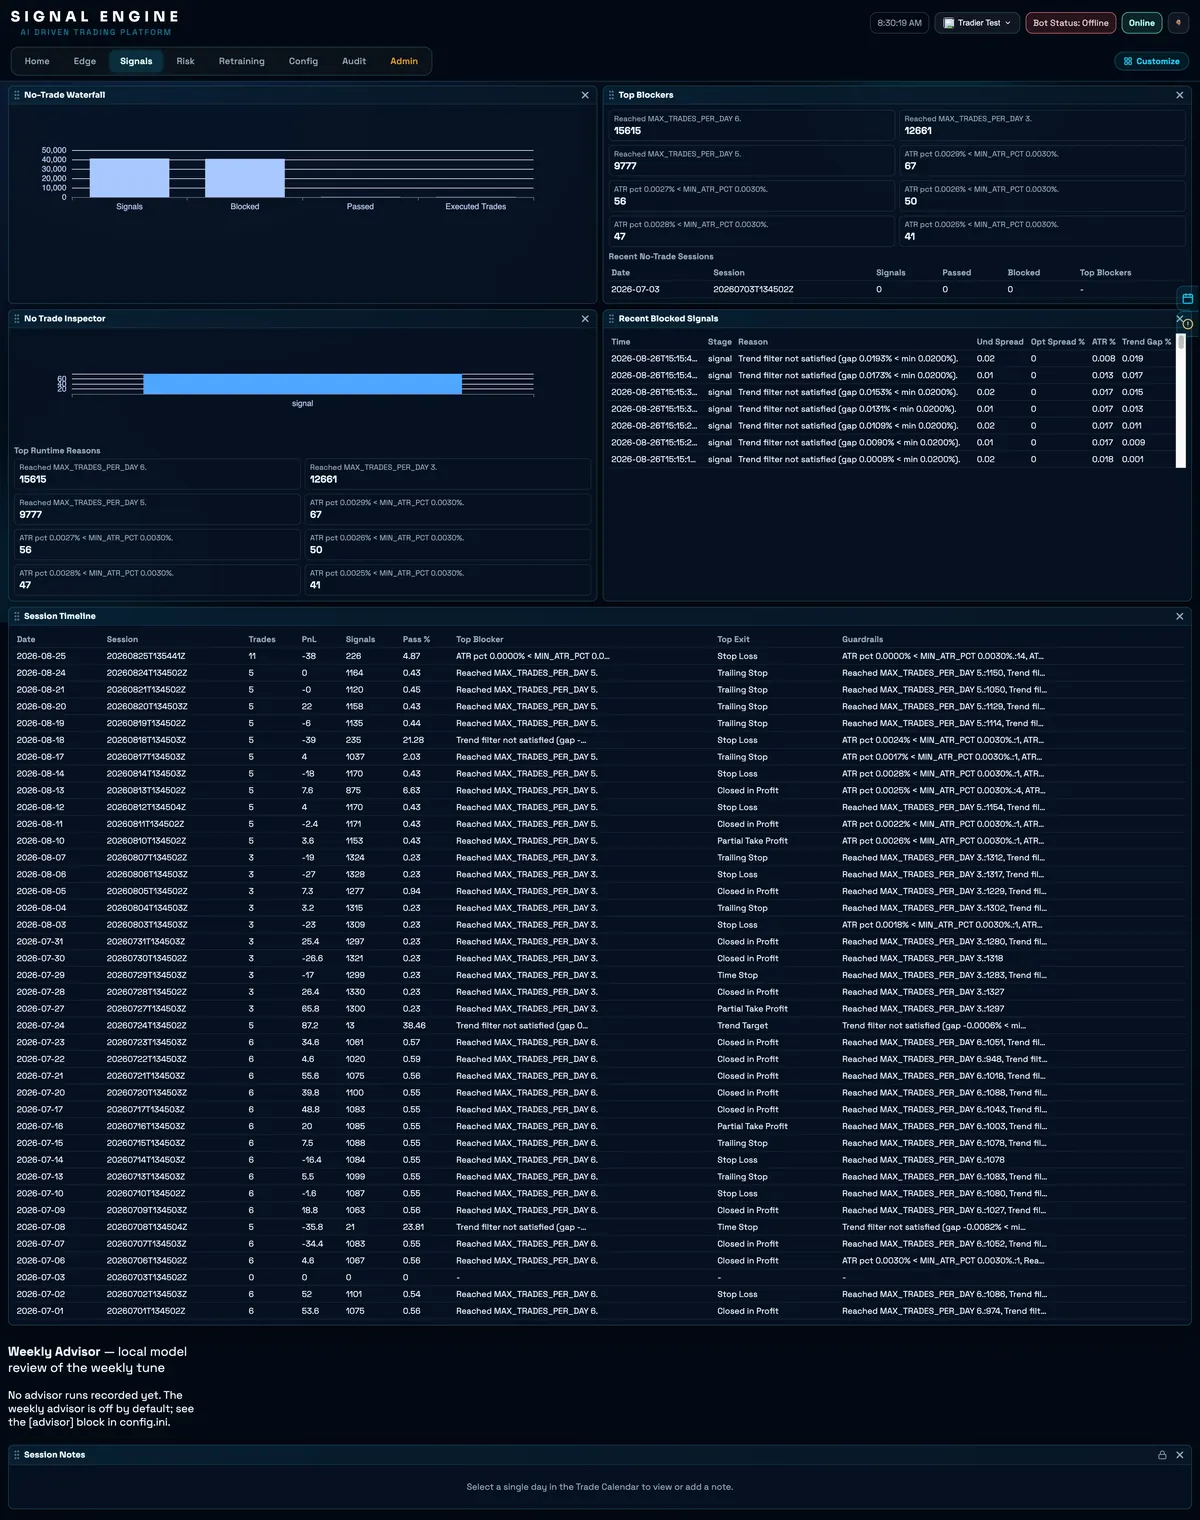
The one that matters is Signals. It's the view most trading dashboards don't have, and it's the whole reason I built the telemetry the way I did.
Forty thousand blocked signals are data, not noise. Signals shows them as a funnel, from everything the engine saw down to the handful it actually traded, and ranks every rejection reason with its exact count and the threshold that tripped it. You can drill into a single stalled signal and see its spreads, its volatility and how far off the trend was.
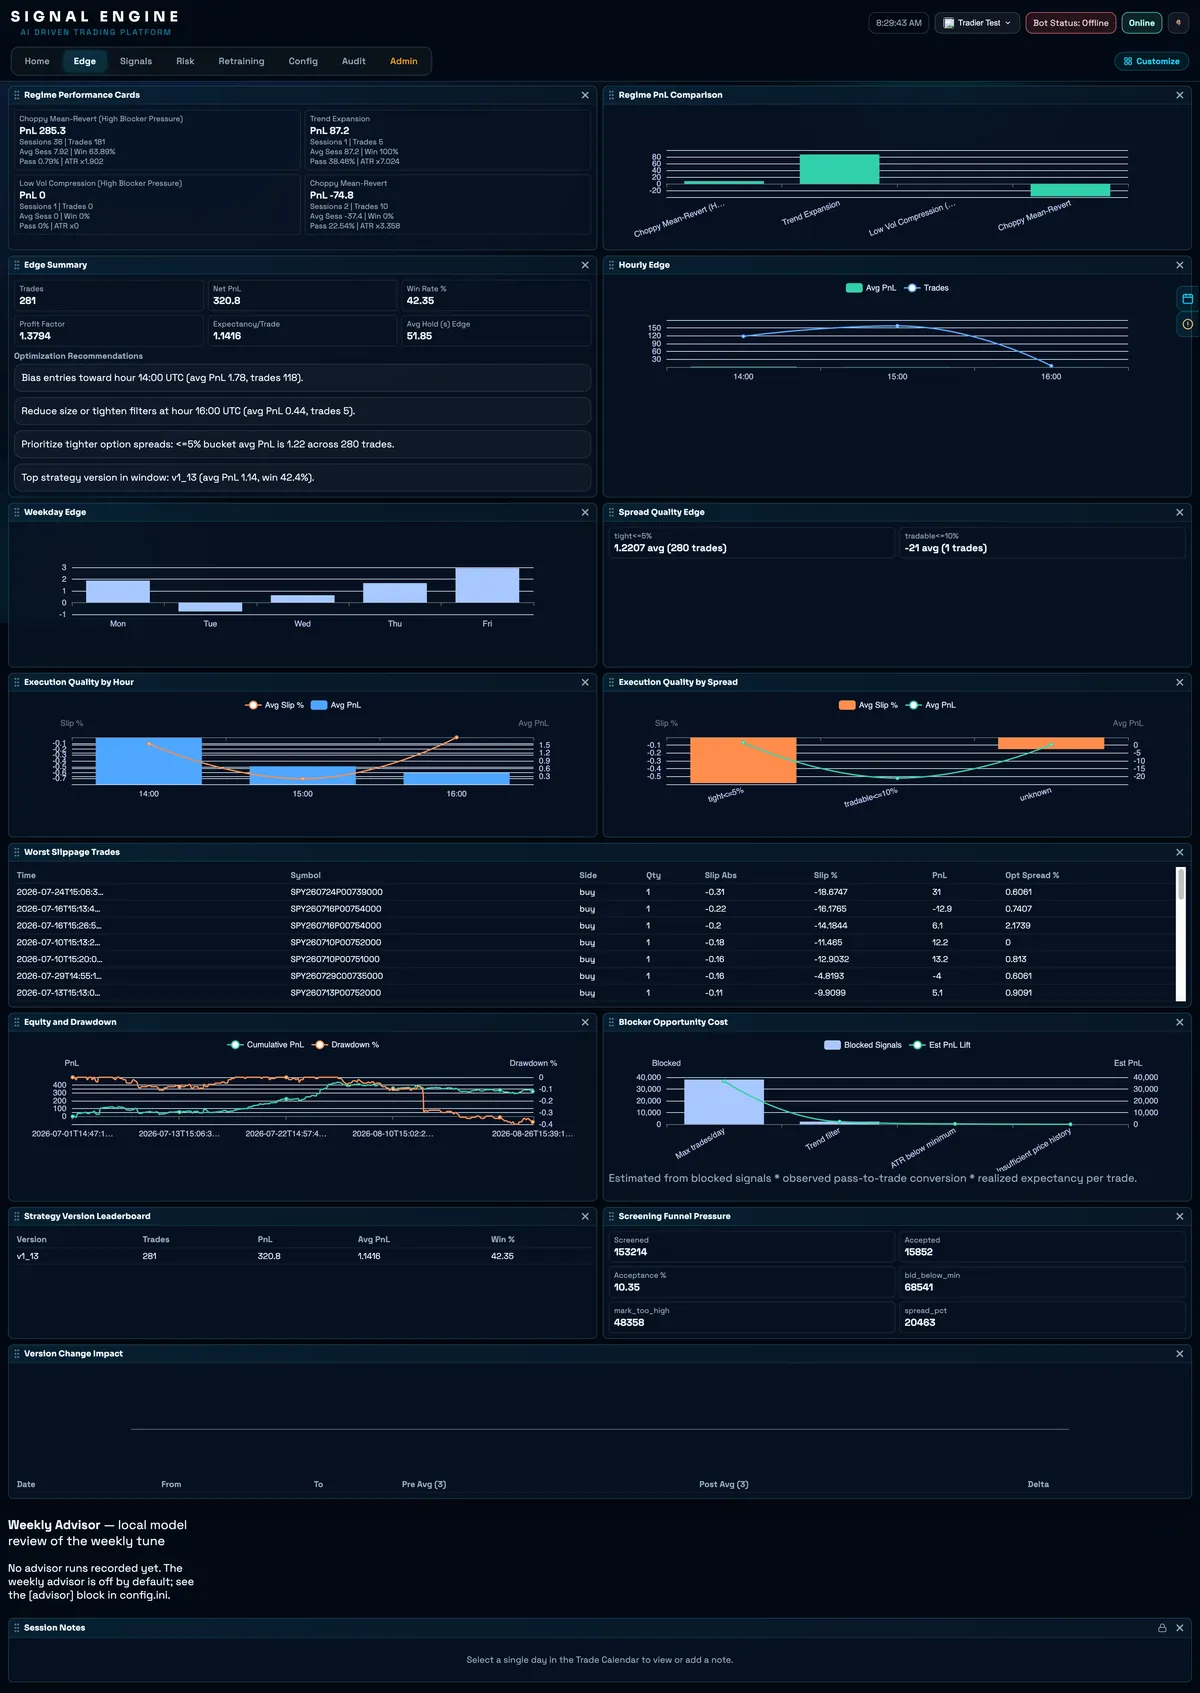
Edge is the other side of that coin. It doesn't ask whether the strategy made money, it asks which conditions it made money under: by market regime, by hour, by weekday, by how good the spread was. It even estimates how much each blocker left on the table. That's the only version of the question you can actually do something about.
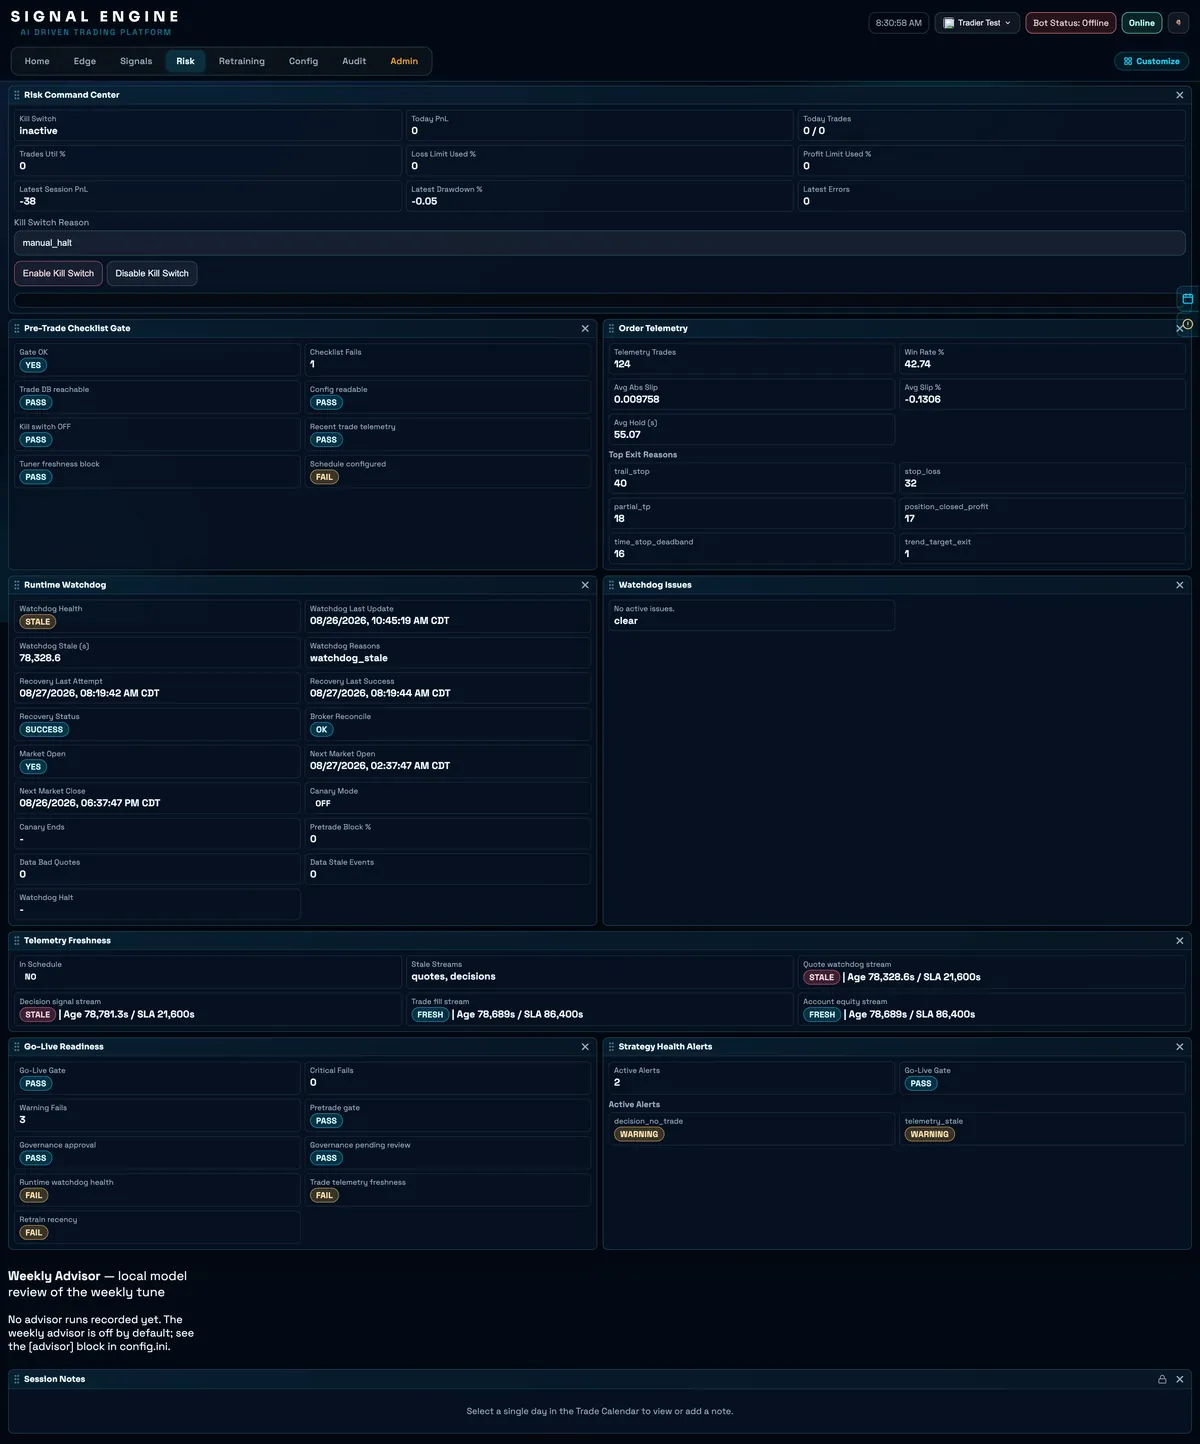
Risk is the panel you open when something feels wrong. Ideally it tells you before it feels wrong. It's where the limits, the watchdog and the pre-trade checklist live, and it's where you arm the kill switch from the browser. Every time you arm it, you have to say why.
Nothing changes without a signature
A weekly tuner looks at how things went and proposes new parameters. It can't promote them itself. A person has to approve the change, that approval is tied to their account, and it expires. If nobody renews it, it lapses on its own instead of quietly becoming permanent.
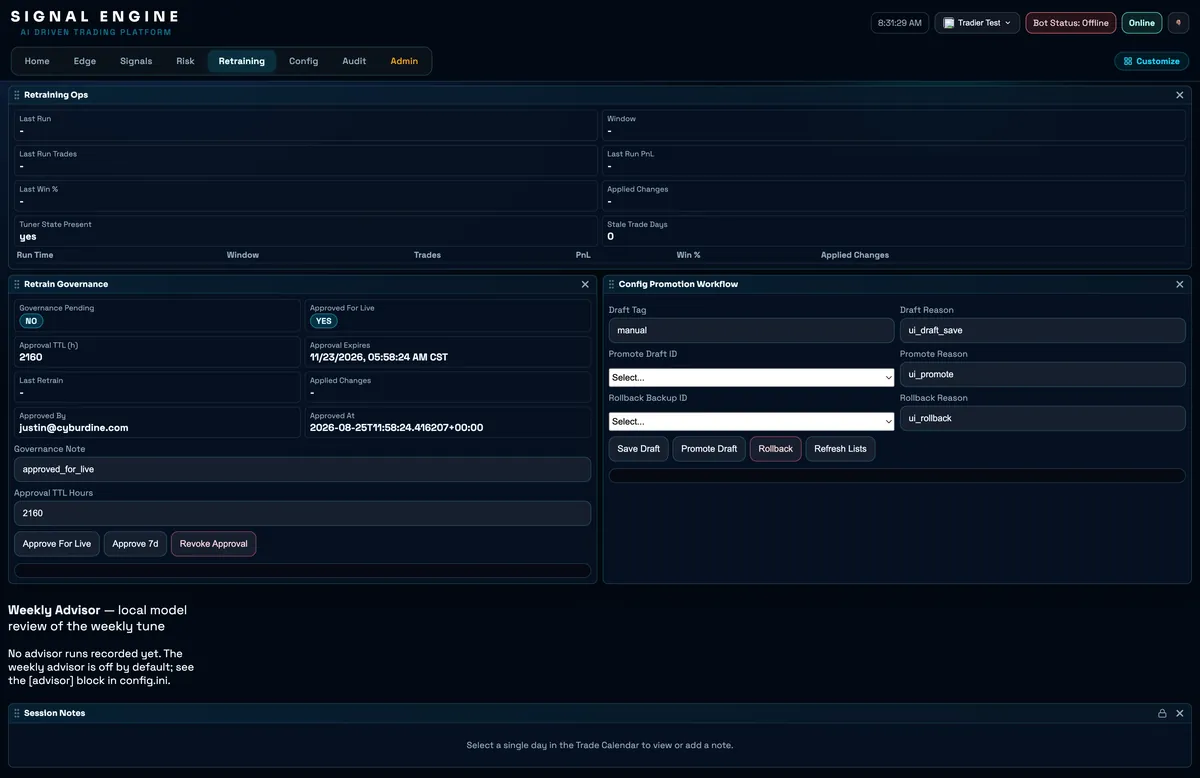
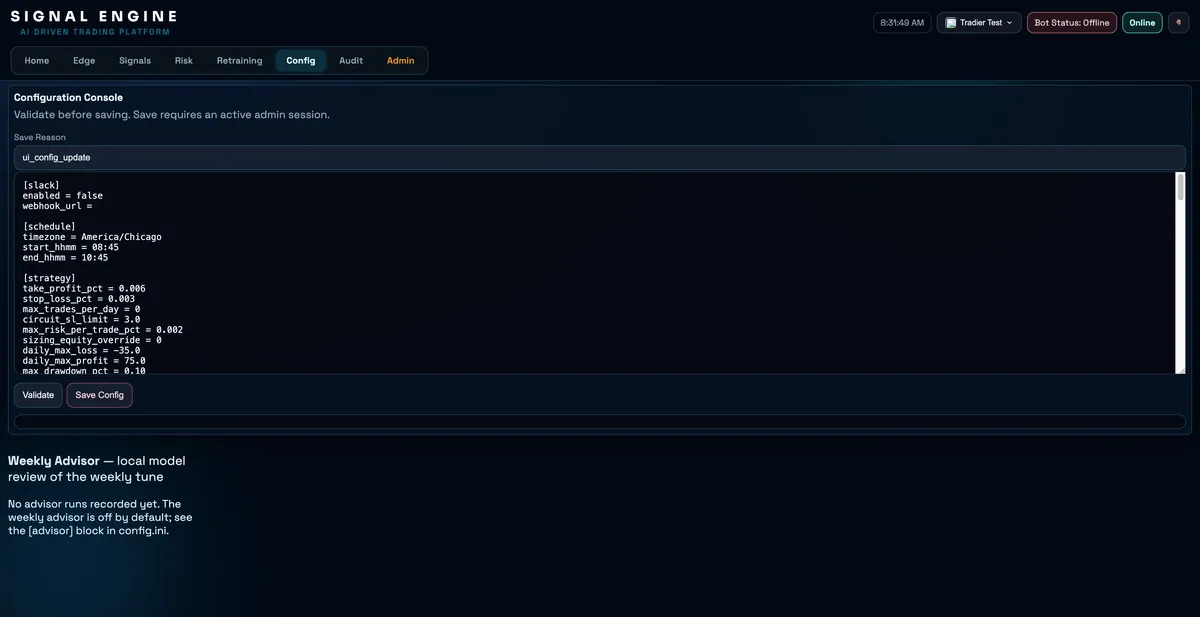
The config works the same way. You can edit the whole file live in the browser, with the secrets masked, but it validates before it saves, you need an admin session to save it, and the reason field isn't optional. Every change is signed by whoever made it.
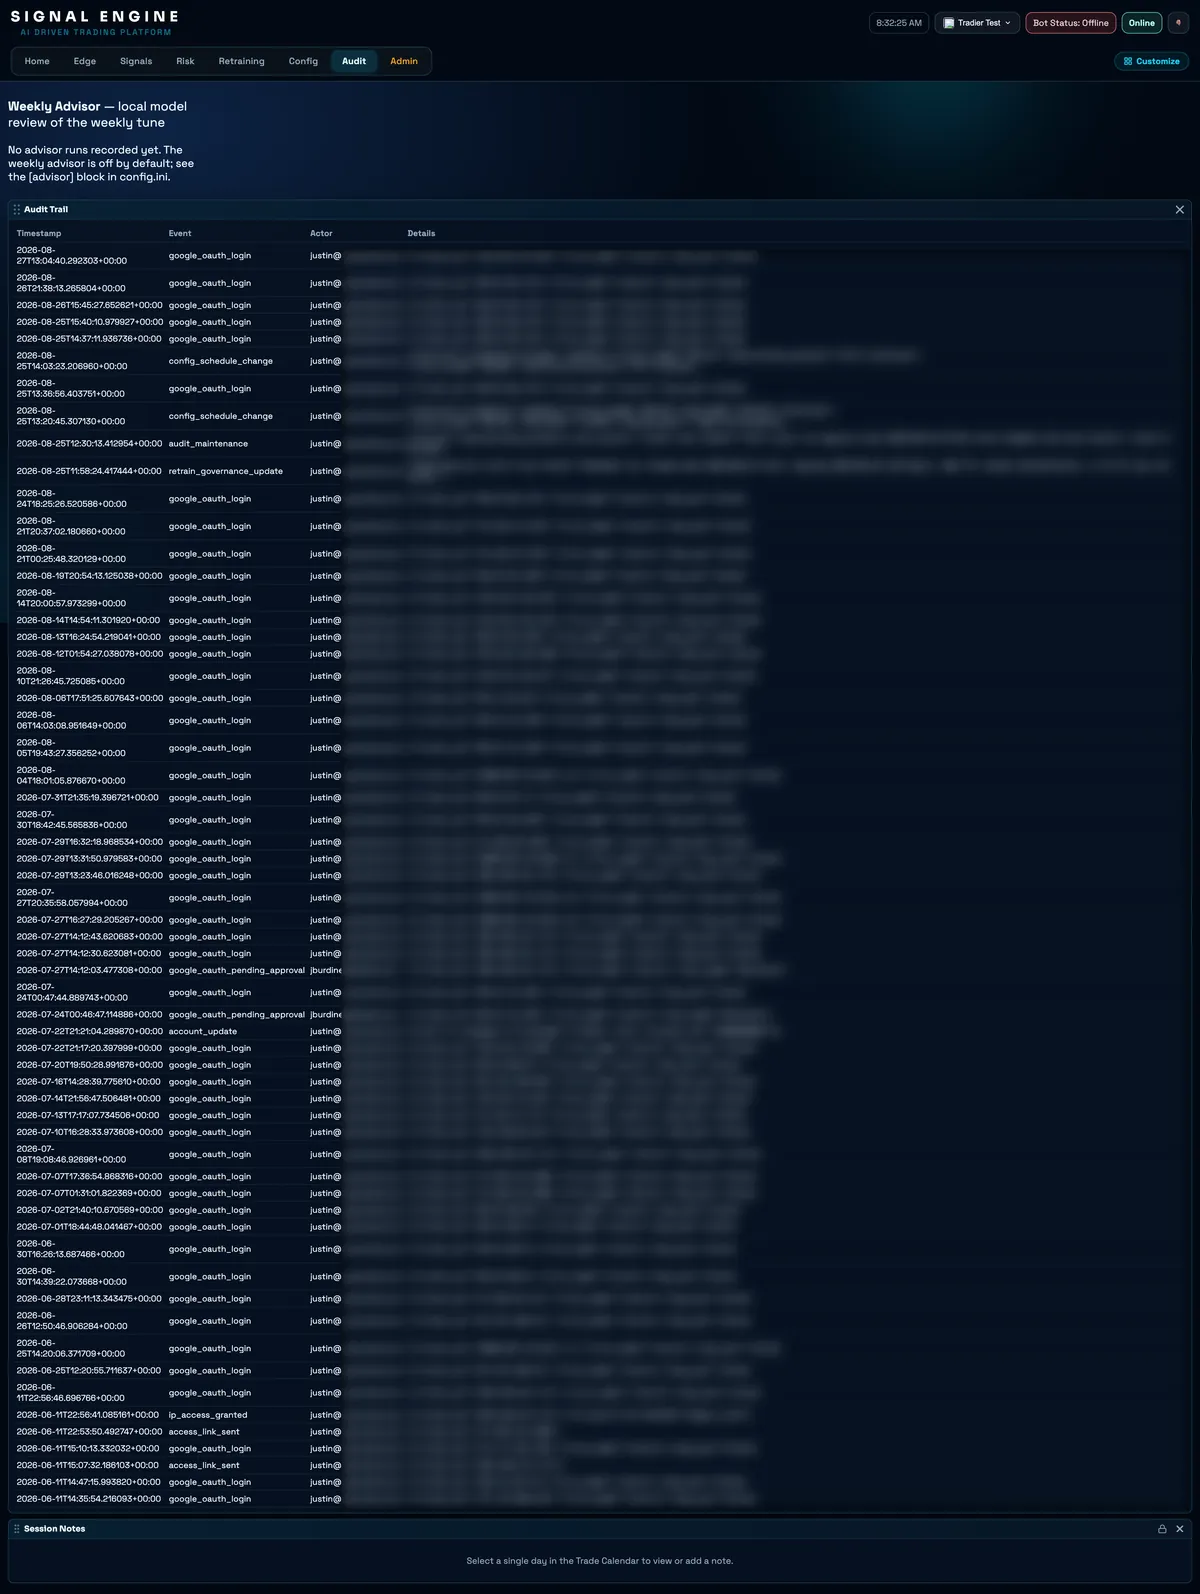
All of that lands in an audit trail you can only add to: logins, config and schedule changes, approvals, access grants, each one stamped to the microsecond with who did it and what things looked like before and after.
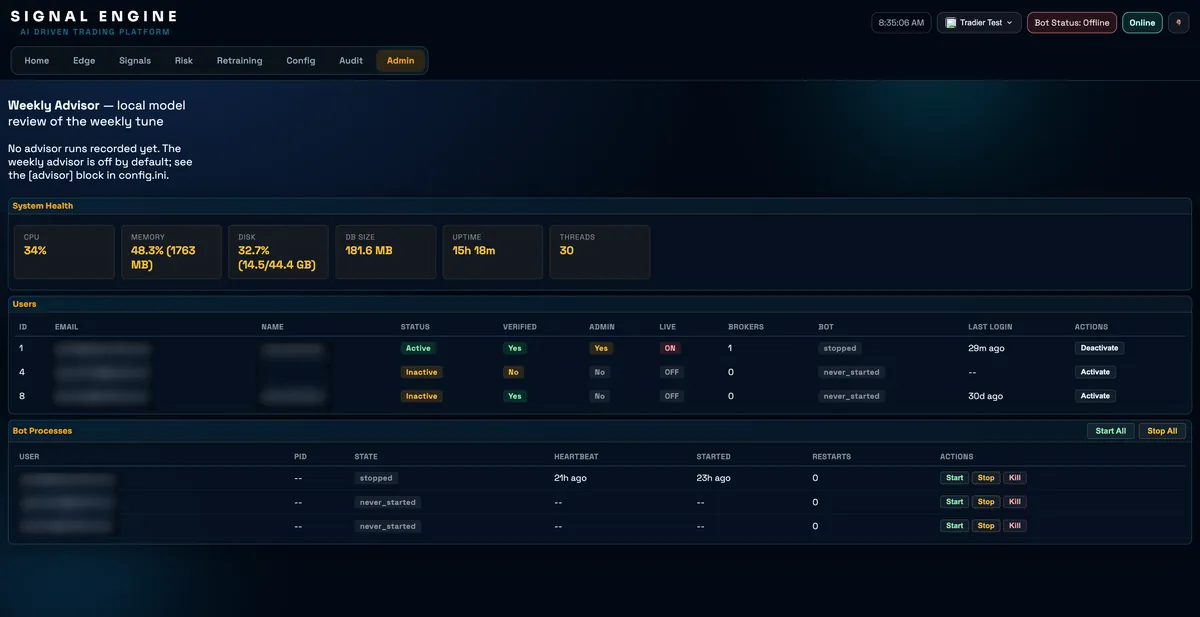
Signal Engine also runs a separate bot for each user, so there's an Admin view for the whole fleet: system health, each process with its heartbeat and restart count, and the buttons to start, stop or kill any one of them. Or all of them at once.
Two small things
Nobody asks for either of these. They're the kind of thing you only build after the tenth time the old way annoyed you.
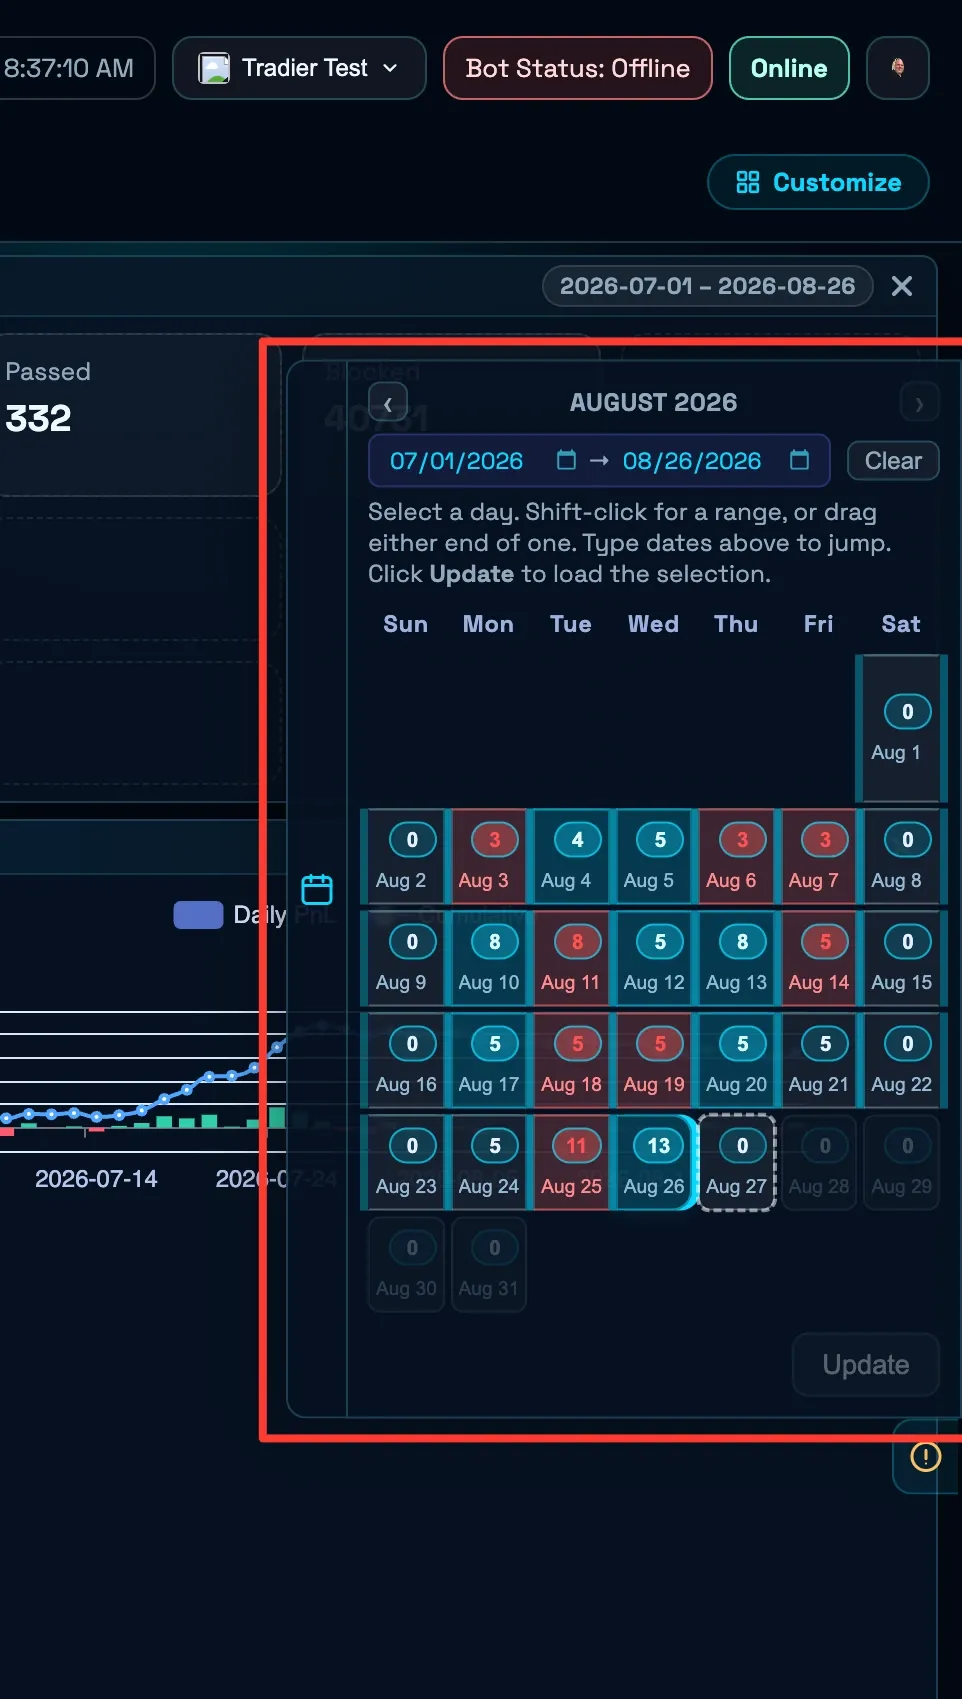
The first is the trade calendar. Every day shows its trade count and turns green or red depending on whether it made money. Click a day, shift-click a range, drag either end, or just type the dates to jump months. Nothing reloads until you hit Update, so you can fiddle with a selection as long as you like and then the whole dashboard re-scopes at once, instead of panel by panel.
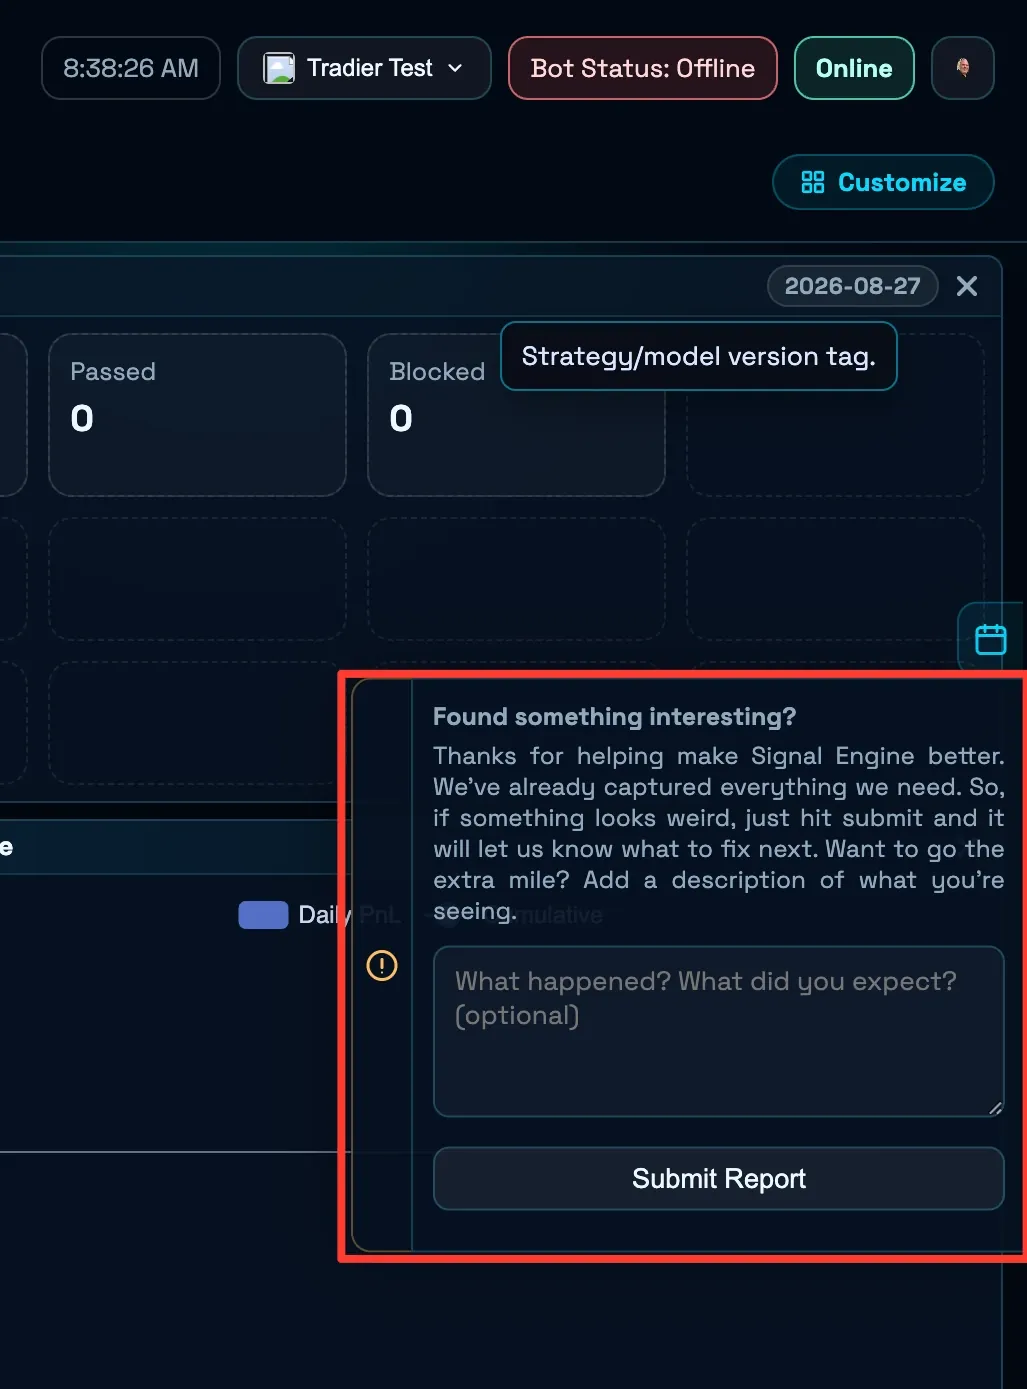
The second is the bug reporter. By the time it opens, it's already grabbed the view you're on, your filters and the console log. Hitting submit on an empty box is a complete report. The description field is there if you want to say more, not as a tax on the person who spotted the bug.
Assume it breaks while you're asleep
A trading bot doesn't fail like a web app. It fails quietly, expensively, and while you're asleep. Nobody files a ticket, because from the outside a broken bot and a patient bot look exactly the same.
So a good chunk of this thing exists purely to notice.
There are two kill switches, a file on disk and an environment variable, and either one flattens everything and stops the loop. Neither depends on the other, or on the dashboard even being up. A watchdog keeps an eye on heartbeats, bursts of bad quotes and whether the broker agrees with me, and it writes down every recovery attempt, so even an incident that healed itself leaves evidence behind.
Every stream of telemetry has its own freshness budget, too. If quotes or fills or equity updates go quiet, that silence is an alert in itself. Silence is never read as health.
And before anything touches real money, there's a canary mode, which trades for a set window with reduced risk, a trade limit and a cap on contract size, and a go-live checklist that splits critical failures from mere warnings. It's how a config change gets near live money without betting the account on being right.
Deliberately boring underneath
Under the hood it's eight modules and one SQLite file, with no external dependencies at runtime. The trading engine and the control plane share nothing but that database, so I can restart either one without the other noticing. It talks to Alpaca or Tradier through the same interface, runs self-hosted behind nginx against Tradier, and handles up to fifteen accounts.
Restraint you can read
Signal Engine spends most of its compute deciding not to trade, and most of its storage explaining that decision afterward. That ratio is the whole design.
The dashboard exists so that restraint is legible. A flat day should read as forty thousand rules doing their job, not a system that might have quietly died at 9:31.
A bot you can't audit is a bot you can't trust.